Budhigandaki Hydropower Project: A Brief Description Dr. Laxmi Devkota Chairman of Budhigandaki Hydro-electric Project Development Committee and Chairman, Nepalese Society of Agricultural Engineers E-mail: lpdevkota@ndri.org.np
Budhigandaki Hydropower Project: A Brief Description
Dr. Laxmi Devkota
Chairman of Budhigandaki Hydro-electric Project
Development Committee
and
Chairman, Nepalese Society of Agricultural Engineers
E-mail: lpdevkota@ndri.org.np
1.
Background
2.
Project location
The Budhi Gandaki Hydropower Project is located on the
Budhi Gandaki River, approximately 2 km from its confluence with Trishuli River
at Benighat that can be accessed by the Prithivi Highway linking Kathmandu and
Pokhara, about 80 km from Kathmandu (Figure 1)
Figure 1: Project Location
3.
Hydrology and Climatology
With a total area of 5005 km2,
the catchment area of the Budhi Gandaki HPP is characterized by a large range
of elevation, from green hills in the south to snow covered Himalayan peaks in
the north. The mean annual rainfall is 1,495 mm with a high spatial variability
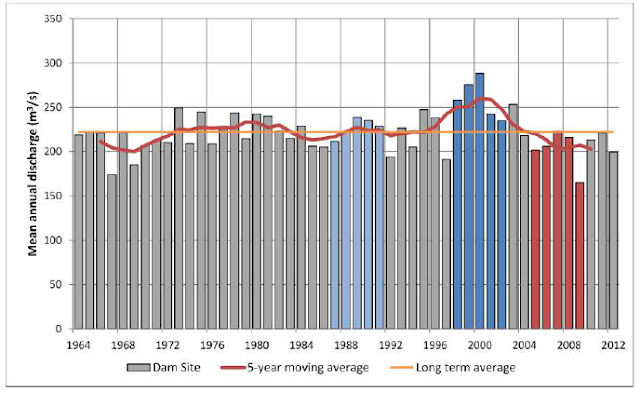
while the mean annual discharge at the dam site was estimated to be 222 m3/s.
It implies that the mean annual flow of the river at dam site is about 7.0 billion
m3 (Figure 2). The 10,000 years flood was estimated to be about 6,260m3/s
and the Probable Maximum Flood (PMF) was about 9,800 m3/s (See
Appendix 1: Salient Features of the Project for details). Glacial lake outburst
flood (GLOF) and landslide dam outburst flood (LDOF) were estimated but the
corresponding peak discharges at the dam site were significantly less than the PMF
and are therefore not governing values for the design of the dam and spillway
structures.
 |
| Figure 2: Mean annual discharge at Dam site |
4.
Sedimentology
A sediment rating curve (sediment discharge vs. river
discharge) based on a 3-year sediment sampling programme was applied to long
term river discharge (1964-2012) and was used to estimate mean annual sediment
inflow to the Budhi Gandaki reservoir. Almost 600 measurements of suspended
sediment concentration and river discharge were used in the development of the
relationships for the high flow and low flow seasons. Sediment inflow to the
Budhi Gandaki reservoir was estimated to be 7.6±2.2 million m3/year.
The volume of sediment due to rare catastrophic events such as LDOF or GLOF was
estimated to be about 2 million m3 for an extreme event. The upper
limit of estimated sediment inflow equal to 9.8 million m3/year is
therefore considered as the annual sediment inflow to the Budhi Gandaki
reservoir. Of this amount an estimated 9.6 million m3 of sediment
per year (458 million m3 after 50 years) will be deposited in the
reservoir without a sediment management strategy. The empirical USBR method,
based on observations in existing reservoirs, was used to estimate the
deposition patterns in the Budhi Gandaki reservoir. The sediment elevation
estimated by this method (depth at which no reservoir capacity is available)
after 50 years is 377 masl i.e. 85m below the power intake invert level which
is at 462 masl. Sediment deposition will occur in both the dead and the active
storages of the reservoir, however the results of the sedimentation study
indicate that only about 7% of the active storage will be lost after 50 years
and about 13% of the active storage will be lost after 100 years.
5.
Seismic Hazard
The Budhi Gandaki dam project falls in the region of
possible future great earthquakes. A large amount of residual stress has to be
released by an earthquake of magnitude, possibly not less than 8.5, with a
rupture likely located along the Main Himalayan Thrust at ~16 km depth, ~20km
to the north of the dam. Considering this fact deterministic Seismic Hazard
Assessment was made and the following horizontal accelerations were taken into
account in the design of the project structures: Operating Basis Earthquake
(OBE): 0.6g and Safety Evaluation Earthquake (SEE): 1.2g
These values are equivalent to
Reference Earthquake Magnitude of 8.7 Richter scale that occurs at 8km below the dam. It is noted here that TERI dam of
India, which is 260.5 m high, was built for 8.5 Richter scale. The earthquake of 25th April 2015 of
magnitude 7.8 Richter scale was of 0.16g. All these figure shows that the dam is quite
safe from seismic hazard point of view.
6.
Reservoir
The salient features of the reservoir are illustrated in
Figure 3 and Figure 4; and given in Appendix 1 too. The reservoir will store about
4.5 billion m3 water at full supply level
(FSL) of 540 masl (meter above mean sea level). The minimum operating level (MOL) will be 496 masl. It means the active storage that
lies between FSL and MOL will be 2.2 billion m3. The surface area of the reservoir at FSL will
be 63 km² which is about 15 times larger than the Phewa Lake of Pokhara.


Figure 4: Reservoir
area-volume curves and storage
7.
Dam
The
dam of this project will be double curvature arch dam as shown in Figure 5. The
maximum height of the dam will be 263 m with crest length of 760 m. The width of
the dam at the base will be 80m while the width at crest will be of 15m. Total
concrete required to construct this dam is about 5.75 million m3.
Figure 5a: Schematic diagram of the dam
8.
Power Generation and Annual
Energy
The turbine used in this project is Francis
type. There will be 6 number of units with rated net head of 200 m. With rated
discharge of 672 m3/s, the plant can generate 1200 MW of
electricity. The
mean annual energy generation by the plant will be 4250 GWh. It will generate
1623 GWh during the 5 months of dry season i.e. from Mansir to Baishak. It
gives the plant factor of about 40% which is a quite good figure when we
compare with other projects in the world.
Table 1: Capacity and
energy output of the Budhigandaki Hydropower Project
9.
Affected Population
Some parts of 27 village development
committees (Gorkha: 14 and Dhading:13) fall under water (63 km2). It
results in total displacement of 3,560 households (Physical and economic displacement)
with a population of 20,260. The other 4557 household are economically
displaced. It accounts the population of 25,351. Thus the total number of
household affected and the number of people affected by the project will be
respectively 8117 and 45,611.
10.
Cost and Duration of Construction
The estimated total cost of the project is
Rs. 260 billion. The duration of construction is about six and half years.
The salient feature of the project is given
in the Appendix 1.
11.
Other Development Possibilities
The project area is not only centrally located
but also 1776 km Mid-Hill Highway linking 24 hilly districts and major emerging
cities is passing through the site. The project is in close proximity to another
highway joining China and India. Further the Budhigandaki reservoir is going to
be about 15 times greater than the Pokhara’s Phewa Lake. These features have provided
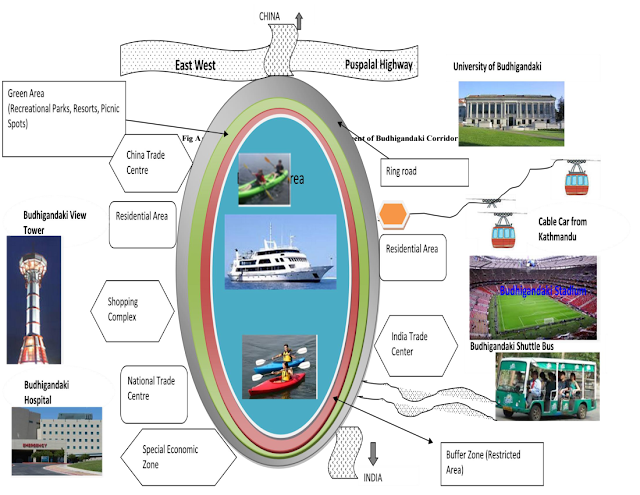
a lot of opportunities of development of different sectors. Tourism and modern
settlement development around the proposed ring road, establishment of
different trade centers: national and international and various shopping
complexes with one complex for one product are some of them to name (please see
the schematic diagram for the possible development given in Appendix 2). Budhigandaki corridor is, thus, becoming an
Economic Hub of Nepal after the completion of Budhigandaki Hydroelectric
Project.
Appendix 1
PROJECT SALIENT FEATURES
1. Reservoir
Full Supply
Level (FSL): 540
masl
Maximum Flood
Water Level: 542
masl
Reservoir
Upper Boundary: 545
masl
Minimum
Operating Level (MOL): 496
masl
Gross Capacity
at FSL:
4.467 billion m3
Active Storage
between FSL and MOL: 2.226 billion
m3
Surface Area
at FSL:
63 km²
2. Hydrology
Catchment Area
5005 km2
Long Term
Average Flow:
222 m3/s
Construction
Flood (20 years):
3070 m3/s
Design Flood
Discharge (10000 years): 6260 m3/s
GLOF
3000 m3/s
LDOF 5200
m3/s
Probable
Maximum Flood: 9800
m3/s
3. Sedimentology
Sediment Inflow:
9.8 million m3/year
Active storage
loss after 50 years: 7%
Active storage
loss after 100 years: 13%
4. Diversion System
Design Flood:
3070 m3/s
Number of
tunnel:
2
Diameter:
12 m
Crest
Elevation of U/S Cofferdam:
357 masl
Crest
Elevation of D/S Cofferdam:
332.50 masl
5. Dam
Type:
Double curvature arch
Maximum Height:
263 m
Crest Length: 760
m
Width at Base: 80m
Width at Crest: 15m
Total Concrete
Volume:
5.75 million m3
6. Spillway
Type Orifice: Gated
spillway with flip bucket
Number of bays: 6
Bay dimensions: Width
5.6 m and Height 8.4 m
Design Flood
(Routed): 6280
m3/s for PMF
Gate Type: Radial
gate with hydraulic hoists
Gate size: 5.6
m x 8.4m, Six gates
7. Waterway and Powerhouse
Intake structures: Bell
mouth intake
Total Rated
discharge:
6x112=672 m3/s
Number of
intake:
6
Invert Level
of Intake:
460 m
Number of Headrace
Tunnel: 6
Powerhouse and
Transformer Building: Outdoor in
the left bank
Width, Length
and Height: W
40 m x L 185 m x H 40 m
8. Generating Equipment
Turbine Type:
Francis
Number of Units: 6
Net Head at
Rated Water Level: 200
m
Rated
Discharge: 6
x 112 = 672 m3/s
Installed
Capacity: 6
x 200 MW = 1200 MW
Mean Annual
Energy: 4250
GWh
Winter Dry Season
Energy: 1623
GWh (Mansir to Baishak-5 months)
Normal
Tailwater Level:
323.30 masl
Generator Type:
Vertical shaft revolving
Generator Capacity: 6 x
235 MVA = 1410 MVA
9. Transmission Lines
Number: 2
Voltage: 400
kV
Circuit:
Double circuit
Conductor: Quad
Bundle MOOSE
Length BG HPP
to Naubise: 40.3
km
Length BG HPP
to Hetauda: 58.7
km
10. Substations
Number:
2
Location
1 in Naubise and 1 in Hetauda
11. Costs
Total Capital
cost: 2593
MUSD
Note: Source
of data and figures presented in this article is the Feasibility Report of
Budhigandaki Hydroelectric Project
Appendix 2


Post A Comment:
0 comments so far,add yours
We value your comments. Let us know your thoughts below!